Overview
A pipeline run tracks:- Timeline - Chronological sequence of node executions with timestamps
- State snapshots - Variable values before and after each node execution
- Run status - Current execution state (In Progress, Completed, Error, Stopped, Interrupt)
- Node progression - Which nodes have executed and which is currently active
- Error information - Detailed error messages and stack traces when failures occur
Pipelines can be executed from two locations:
- Pipeline Editor (Run tab) - Direct execution environment
- Chat → Canvas - Conversational execution interface
Run States and Status Tracking
Pipeline Run States Each pipeline run progresses through distinct execution states. The current state is displayed in the Run Chipset within the Flow View (Configuration tab).| State | Visual Indicator | Description | Available Actions |
|---|---|---|---|
| In Progress | Pipeline is actively executing nodes | Stop execution | |
| Completed | All nodes executed successfully | View details, Delete run | |
| Error | Execution failed with an exception | View error details, Delete run | |
| Stopped | Manually stopped by user | View partial results, Delete run |
Run states are visible in the Flow View (Configuration tab), where the Run Chipset displays current and recent runs with their status indicators.
Accessing Run Information
The Run Chipset appears in the Configuration tab (Flow View) and provides access to detailed run information.From Flow View (Pipeline Editor)
Run Chipset Display:- Single Run: Shows one run chipset with status icon and run name
-
Multiple Runs: Shows current run + history icon (🕐 clock icon) to access previous runs
- Click the history icon to view a dropdown of all previous runs
- Current/most recent run is always displayed separately
- Each run in the dropdown can be opened (click run name) or deleted (click delete icon)
From Chat Interface
Access run information from chat executions through Canvas mode:- Navigate to Chat and add/select a pipeline
- Execute pipeline with input or conversation starters
- Click Settings(gear) button → Canvas view opens
- Click Flow Editor tab
-
View Run Chipset and click run name for details
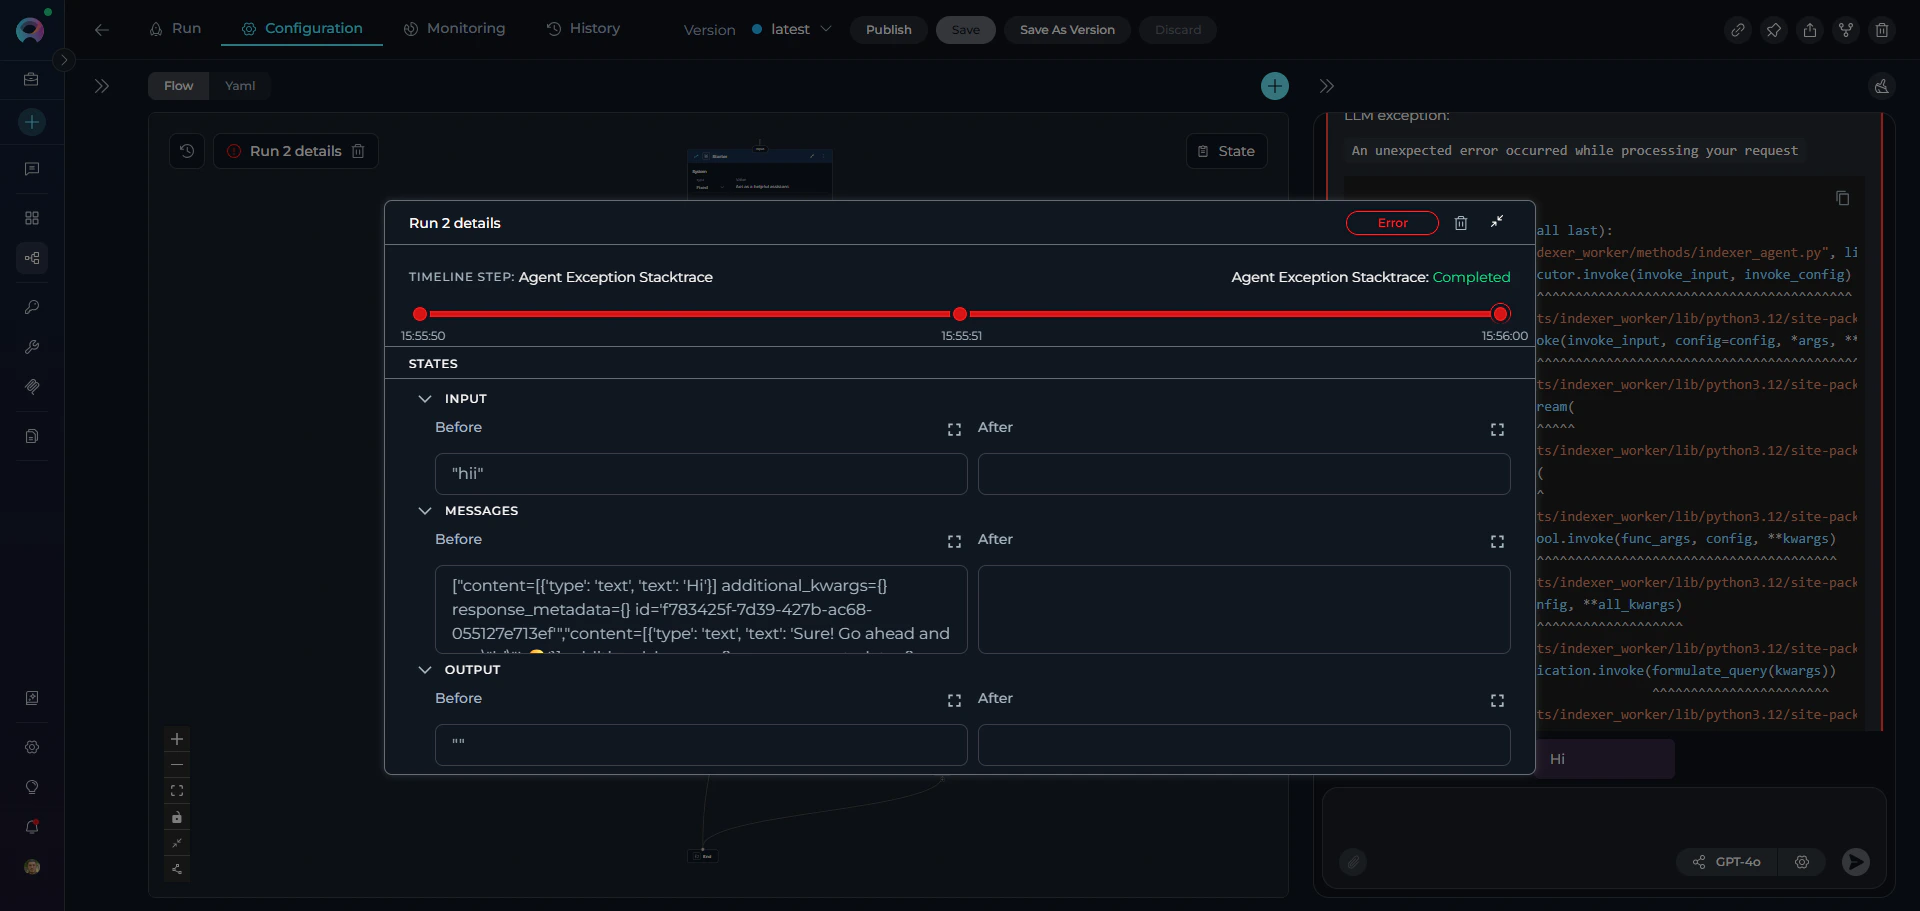
Run Details Dialog
Click on any run name in the chipset to open the Run Details Dialog, which provides comprehensive information about the execution. Dialog Sections:-
Header
- Run name/label
- Current status badge
- Action buttons (Stop/Delete)
- Close button
-
Timeline Section
- Timeline Step: Shows current node being executed (or last completed node)
- Status Indicator: Real-time status of the current node
Status Description Visual Indicator In Progress Node is actively executing 
Completed Node finished successfully 
Error Node failed with an error 
Stopped Manually stopped by user 
- Visual Timeline: Stepper component showing all executed nodes
- Each step shows timestamp (HH:mm:ss format)
- Click any step to view its state details
- Green connector line indicates successful progression
- Red connector line indicates error occurred
-
States Section
- Expandable accordion for each state variable
- Before and After values for each node execution
- Full-screen view button for detailed inspection
Monitoring Execution
Real-Time Monitoring
During Active Execution:- Run Chipset: Shows blue circular progress indicator in Flow View
- Timeline Tracking: Run Details Dialog displays current node and timestamp
- Node Highlighting: Active node highlighted in Configuration tab
- Chat Progress: Results stream progressively in Run or Chat interface
- Click run name in Run Chipset
- Run Details Dialog opens
- Timeline shows current node execution
- States section displays real-time variable values
Active Execution Indicators
Flow View (Configuration Tab):- Run chipset displays with blue progress spinner
- Current node highlighted on canvas
- Timeline step shows “Performing” status
Output Viewing
State Inspection:- Open Run Details Dialog
- Expand state variable accordions
- View before/after values for each node
Debugging and Error Handling
Error State Details
When a run enters Error state, the Run Details Dialog provides:- Error message: Exception details displayed in red
- Failed node: Timeline highlights node where error occurred
- State snapshot: Variable values at time of failure
- Stack trace: Technical error information in chat interface
Best Practices
State Variable Management
State Variable Management
Initialize with defaults:Always map node outputs:
Using Interrupt Points Effectively
Using Interrupt Points Effectively
Use interrupts for:
- Validating data transformations
- Manual approval gates
- Debugging complex workflows
- Human-in-the-loop processes
Run Monitoring Tips
Run Monitoring Tips
During Development:
- Use interrupt points to inspect state
- Add descriptive node names for clarity
- Test with edge cases and invalid inputs
- Monitor run history for patterns
- Track error rates in Monitoring tab
- Set appropriate step limits
- Configure conversation starters for guidance
Troubleshooting
Common Execution Errors and Solutions
Hardcoding State Variables for Debugging
Hardcoding State Variables for Debugging
Purpose: Temporarily override state variable values to test specific scenarios or isolate issues.Method: Set fixed values directly in the Use Cases:
state section:- Skip user input: Test pipeline logic without manual entry
- Reproduce errors: Lock specific values that caused failures
- Isolate node behavior: Test individual nodes with known inputs
- Validate transformations: Use predictable data to verify outputs
- Document hardcoded values with comments
- Remove or revert before production deployment
- Use interrupt points to verify hardcoded values are applied
- Test with multiple hardcoded scenarios (edge cases, invalid data)
Error: Entry Point Not Defined
Error: Entry Point Not Defined
Error Message:Cause: Pipeline has no starting node configured.Solution:
- Open pipeline in Configuration tab
- Click three dots (⋮) on the node that should start execution
- Select “Entry Point” from the menu
- Save the pipeline
Error: Missing Required Parameter
Error: Missing Required Parameter
Error Message:Cause: Node’s input_mapping references undefined or empty state variable.Solution:
- Check if variable is defined in
statesection - Verify previous nodes populate the variable
- Add default value if appropriate:
Error: Node Transition Undefined
Error: Node Transition Undefined
Error Message:Cause: Node’s transition points to non-existent node.Solution:
- Open Flow Designer
- Check connection from failing node
- Ensure target node exists and is properly named
- Update transition to correct node ID or END
Error: State Variable Type Mismatch
Error: State Variable Type Mismatch
Error Message:Cause: Variable assigned value of wrong type.Solution:
- Ensure type conversion in Code nodes:
Interpreting Error Messages
Interpreting Error Messages
Understanding Error Structure:Key Components:
- Node Name: Where the error occurred
- Exception Type: Type of Python error (KeyError, ValueError, etc.)
- Error Details: Specific message about what went wrong
- Stack Trace: Technical execution path (focus on end)
- Current State: State variables at time of error
- Focus on the last exception in the stack trace
- Check Current State section for variable values
- Node Name tells you exactly where to look in your pipeline
- Exception Type hints at the category of problem
- Pipeline Overview - Understanding pipeline concepts and architecture
- Pipeline Nodes - Complete guide to all node types
- Pipeline States - Managing state variables and data flow
- Flow Editor - Visual pipeline design and editing
- YAML Configuration - Text-based pipeline definition
- Agents and Pipelines History - Detailed history tab guide
- Troubleshooting - Common issues and solutions