Quick Health Checklist
Use this checklist for rapid system verification: ✔️ Socket Connection Socket indicator shows green dot (on Elitea logo, top-left corner) The socket connection indicator shows the real-time connection status between your browser and the ELITEA server:- Green dot = Connected and ready

- Red dot = Disconnected - check your network connection

- Connected and ready

- Disconnected - MCP server not running

- Indexes tab is automatically disabled if required prerequisites are not met. To access this tab in your toolkit configuration, ensure:
- PgVector Configuration: Vector storage must be configured at project level (Settings → AI Configuration)
- Embedding Model: An embedding model must be selected and configured (Settings → AI Configuration)
- Index Data Tool: The “Index Data” tool must be enabled in your toolkit configuration
- Delete button (in Indexes tab) is disabled if Remove Index tool is not selected in toolkit configuration
- Run tab (in Indexes tab) is disabled if at least one search index tool (Search Index, Stepback Search Index, or Stepback Summary Index) is not selected in toolkit configuration
Common Issues: Quick Fixes
Agent & LLM Problems
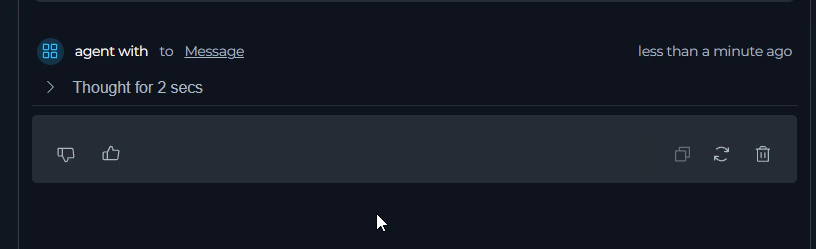
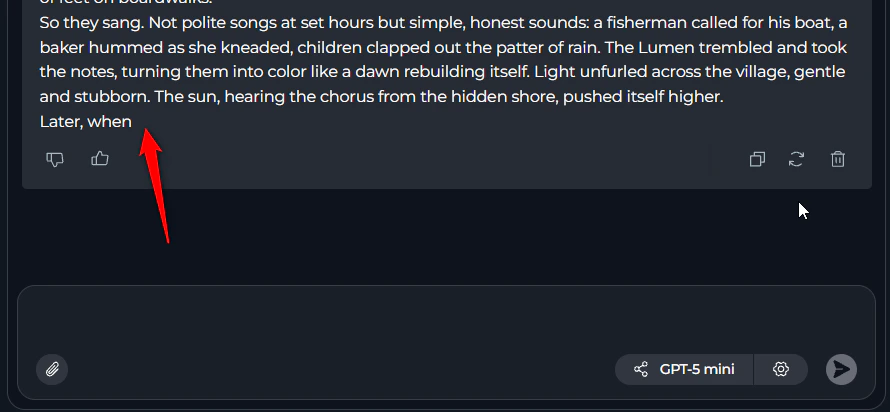
**Agent stops or provides incomplete responses**
**Agent stops or provides incomplete responses**
Symptoms: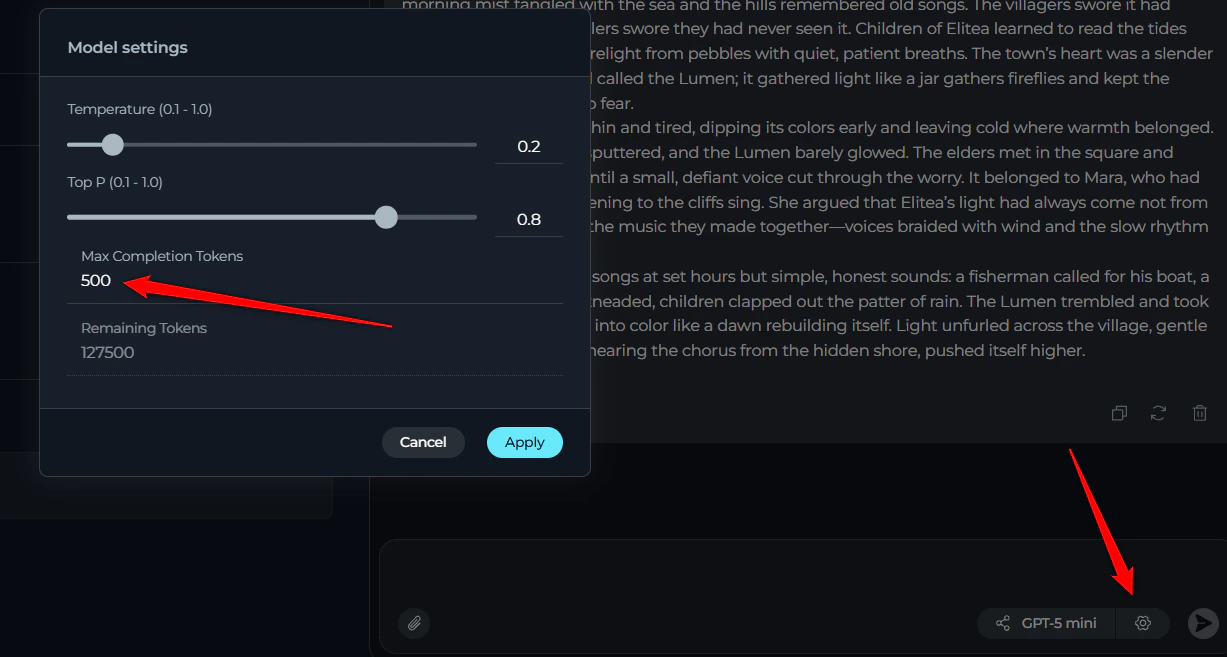
- Agent starts working but stops mid-response
- Answer appears truncated or incomplete
-
Complete answer visible in “thinking step” but not final response
- Open agent configuration (⚙️ settings icon)
- Locate “Max completion tokens” field
- Increase value (e.g., from 2000 to 4000 or higher)
- For nested agents: Check each agent’s token limits
- Save and retry
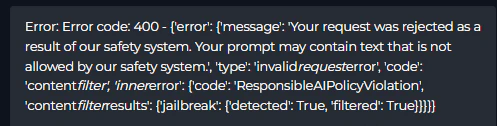
**Content policy violation (400 error)**
**Content policy violation (400 error)**
Symptoms:
- “This conversation violates our policy”
- “Message filtered due to prohibited content”
-
“Rejected as a result of our safety system”
- Review your prompt for sensitive topics
- Rephrase instructions that might look like prompt injection (e.g., “Ignore user input”)
- Clearly state the purpose of security-related instructions
- Avoid prohibited content per your provider’s policy
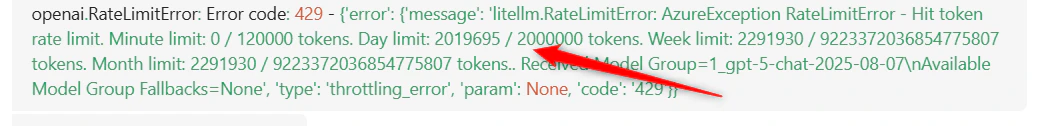
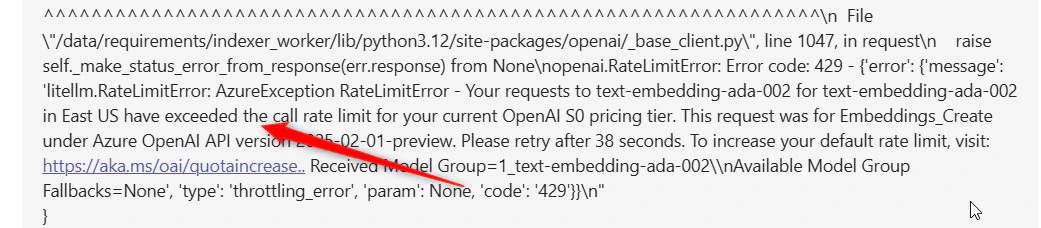
**Rate limit exceeded (429 error)**
**Rate limit exceeded (429 error)**
Symptoms:
- “Hit token rate limit. Minute limit: X / Y tokens”
-
Error appears during heavy usage or repeated requests
- Wait 1-5 minutes and retry
- Switch to a different LLM model if available
- Reduce request frequency or batch operations
- For shared environments: Coordinate with team to spread usage
**Context length exceeded (400 error)**
**Context length exceeded (400 error)**
Symptoms:
- “This model’s maximum context length is X tokens. However, your messages resulted in Y tokens”
-
Error when processing large files or long conversations
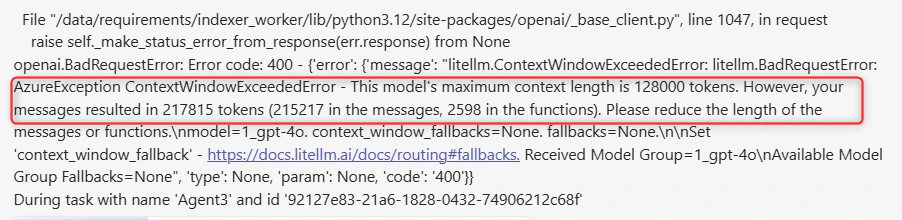
- GPT-4o: 128,000 tokens
- Claude Sonnet: 200,000 tokens
- GPT-5: 400,000 tokens
- Reduce input size: Break large files into smaller chunks
- Use summarization: Summarize content before passing to LLM
- Use indexing: Instead of passing full documents, use toolkit indexing and semantic search
- Clear chat history: Start a new conversation to reduce context
Toolkit & Integration Problems
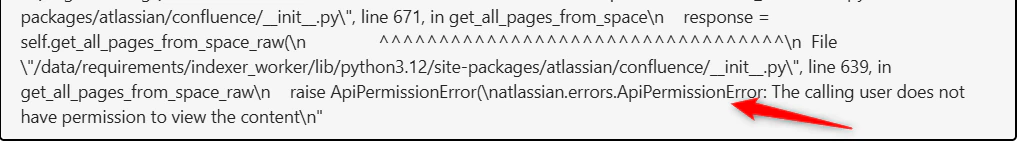
**Indexing fails with permission errors**
**Indexing fails with permission errors**
Symptoms:
- “The calling user does not have permission to view the content”
- Indexing stops or fails partway through
-
Some items indexed, others skipped
- Use filters to exclude restricted items:
- Jira: Add JQL filter in toolkit configuration
- Confluence: Add CQL filter in toolkit configuration
- Verify token permissions: Ensure API token has read access
- Retry indexing: Some failures due to items deleted during indexing
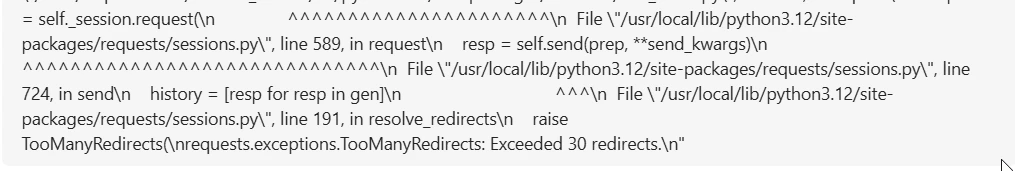
**Atlassian API redirect errors (Too many redirects)**
**Atlassian API redirect errors (Too many redirects)**
Symptoms: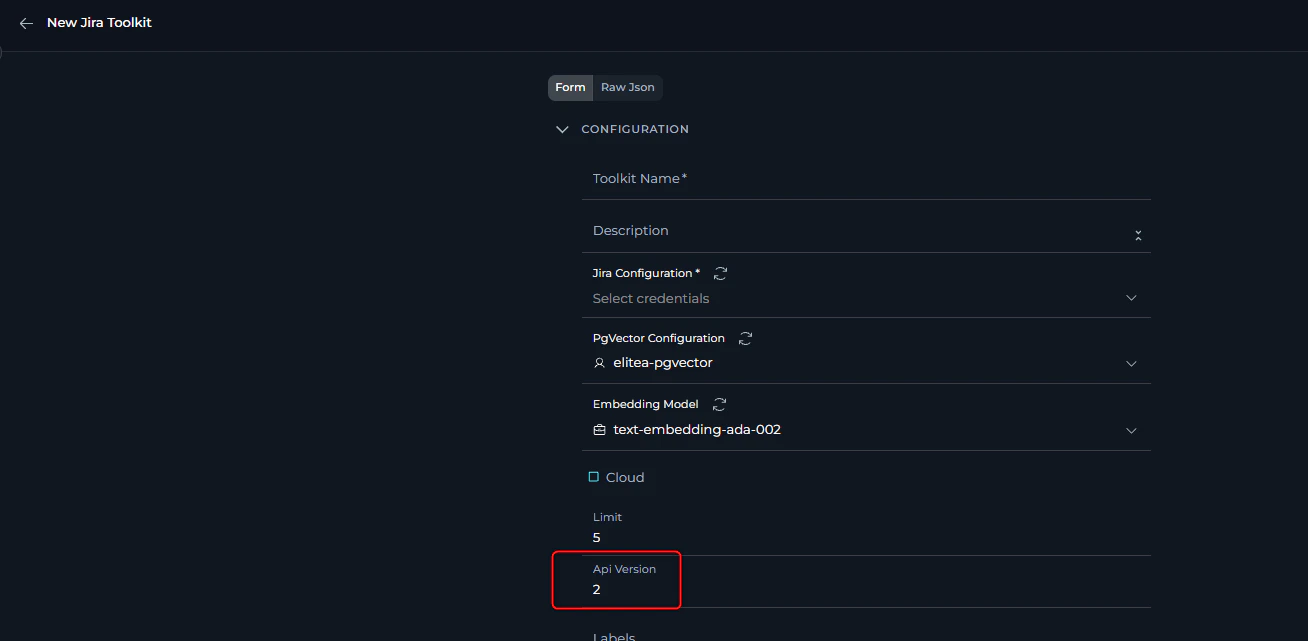
- “Exceeded 30 redirects”
- Some toolkit tools work, others don’t (e.g., can’t fetch images)
-
Connection repeatedly fails
- Open toolkit configuration
- Locate API Version field
- Set correct version:
- Atlassian Cloud: API version 3
- EPAM Jira/Server: API version 2
- Save and test connection
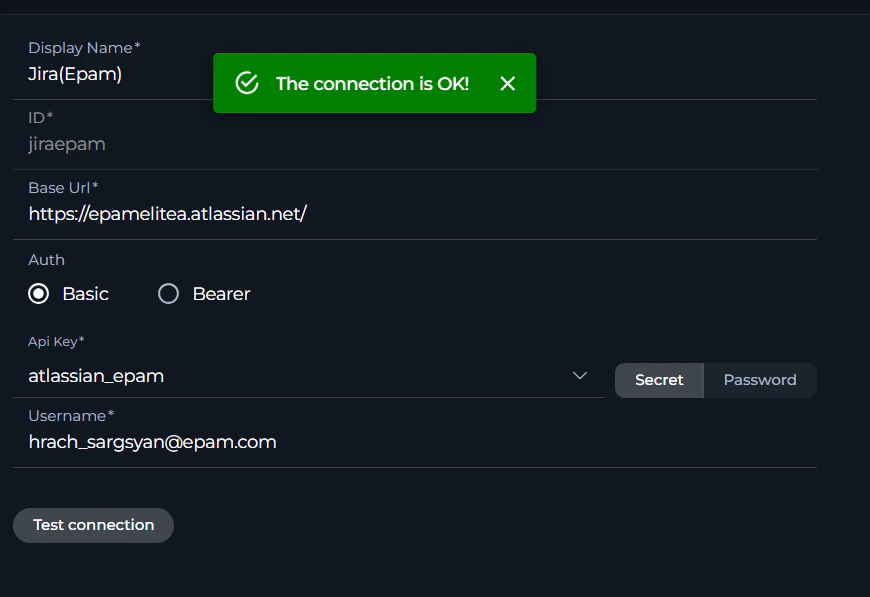
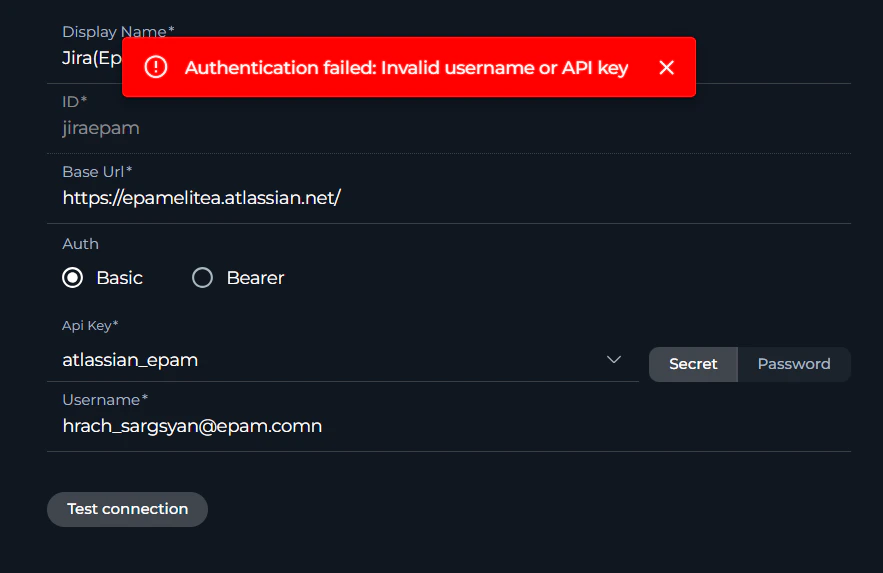
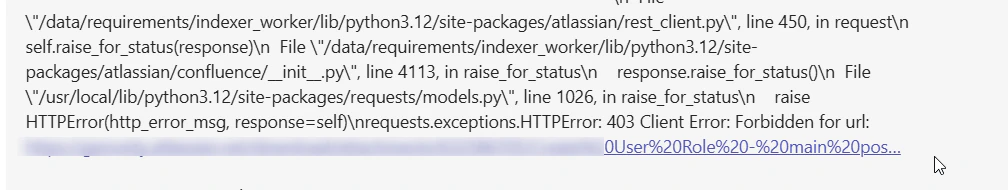
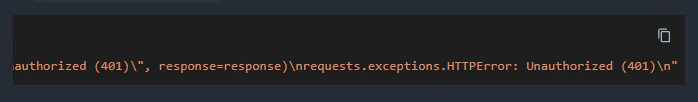
Symptoms:
- “Unauthorized (401)” error
- “Permission denied” or “Access forbidden”
-
Toolkit connection fails
- Cloud: Use Basic Auth with API key + username
-
Server/EPAM: Use Bearer Token with API key only
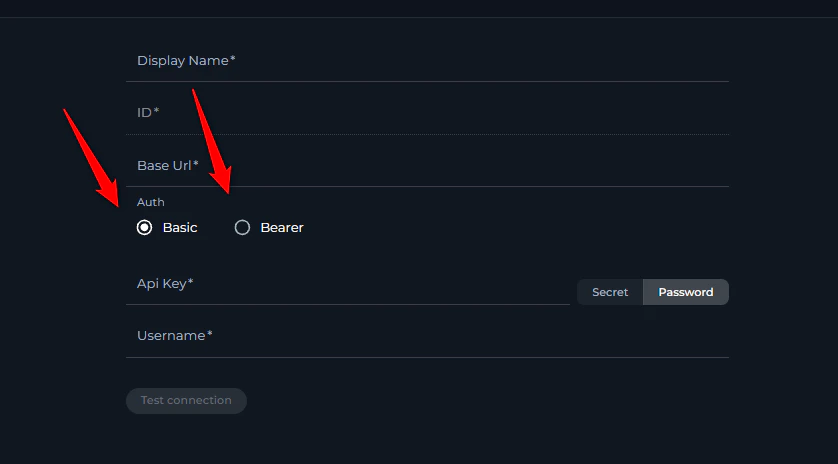
- Verify credentials in Credentials menu
- Click “Test Connection” button
- Check for extra spaces in API keys/tokens (common issue!)
- Ensure token hasn’t expired
- Verify user has necessary permissions
**Toolkit configuration validation errors**
**Toolkit configuration validation errors**
Symptoms: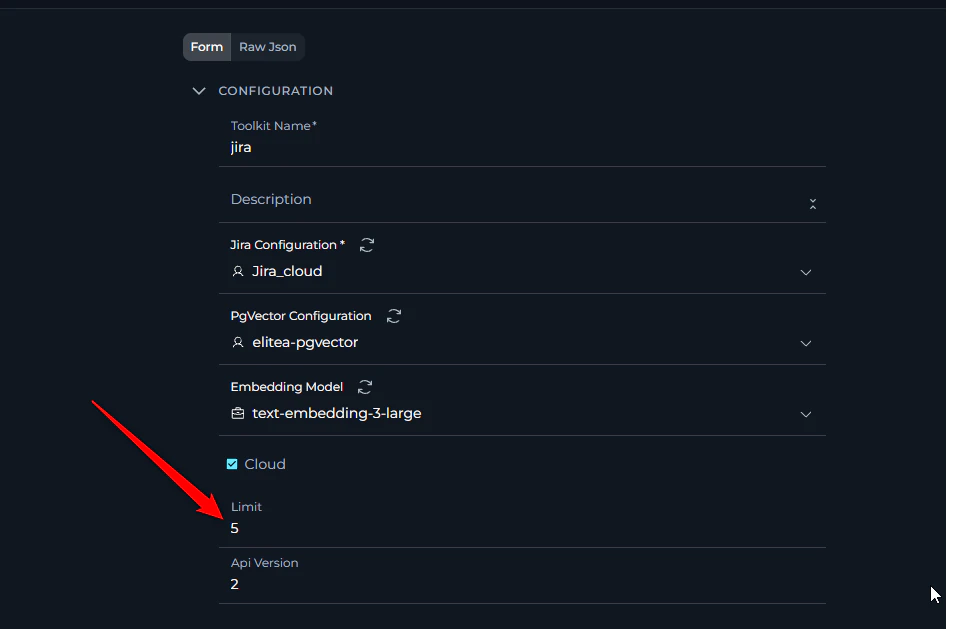
- Toolkit returns small number of results
- You know more items exist but they’re not shown
- Lists appear incomplete
- Go to Toolkits menu
- Edit the affected toolkit
- Find “Limit” field (may be in Advanced Settings)
- Increase value (e.g., from 10 to 100, or 50 to 500)
- Save configuration
- Retry your query
Pipeline Configuration Problems
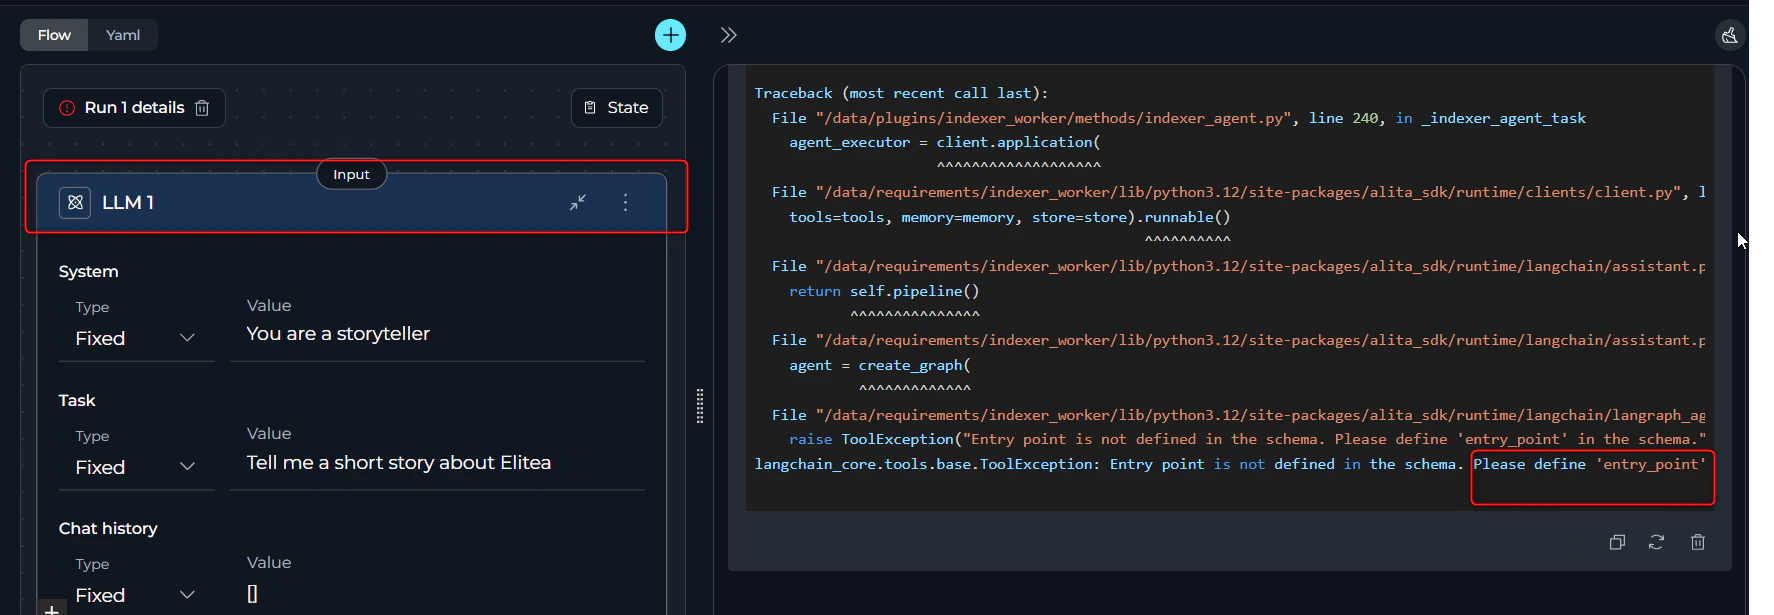
**Entry point not defined error**
**Entry point not defined error**
Symptoms: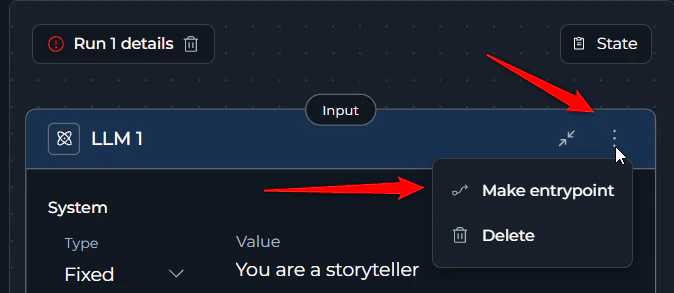
- “Entry point is not defined in the schema”
- Pipeline fails immediately on start
-
Error appears before any execution
- Open your pipeline
- Identify the first node that should execute
- Click three dots (⋮) on that node
- Select “Entry Point” option
- Save and retry
**Pipeline input processing issues**
**Pipeline input processing issues**
Symptoms: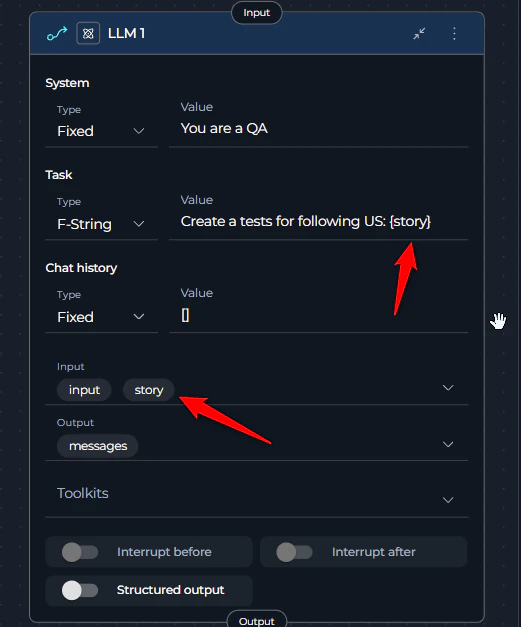
- Node ignores provided input
- Responses are general instead of specific to your data
-
Variables seem to not work
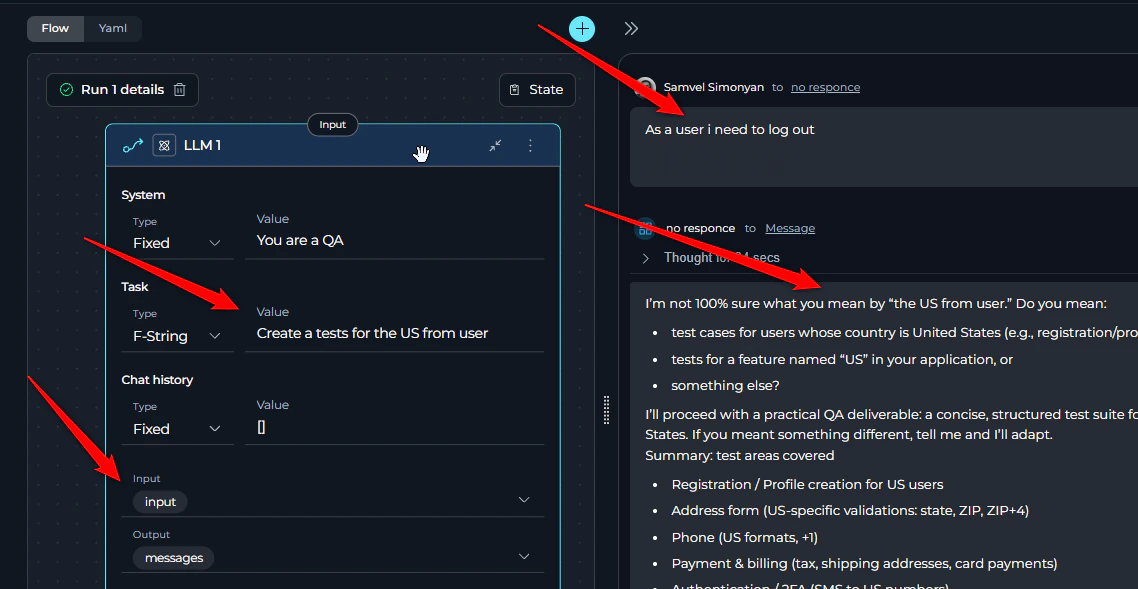
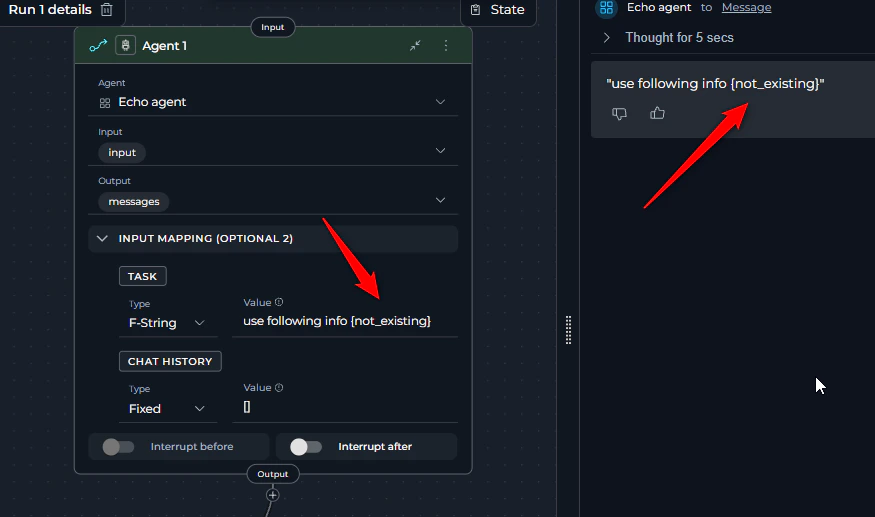
- Open node configuration
- In the Task field, add variable references:
- Using f-string:
Analyze this data: {input_data} - Using variable syntax: Select variable from dropdown
- Using f-string:
- Verify variable names match exactly (check for typos!)
- Variables in “Input” section must be referenced in task to be used
- Save and retry
- Full Troubleshooting Guide: Detailed error messages with screenshots
- FAQs: Frequently asked questions
- Contact Support: Get additional help