> ## Documentation Index
> Fetch the complete documentation index at: https://docs.elitea.ai/llms.txt
> Use this file to discover all available pages before exploring further.
# Pipeline Runs
> Pipeline runs represent the execution of your workflow, capturing the complete execution state and progression through nodes. Each run maintains a detailed time
## Overview
A pipeline run tracks:
* **Timeline** - Chronological sequence of node executions with timestamps
* **State snapshots** - Variable values before and after each node execution
* **Run status** - Current execution state (In Progress, Completed, Error, Stopped, Interrupt)
* **Node progression** - Which nodes have executed and which is currently active
* **Error information** - Detailed error messages and stack traces when failures occur
Pipelines can be executed from two locations:
* **Pipeline Editor** (Run tab) - Direct execution environment
* **Chat → Canvas** - Conversational execution interface
Both methods provide identical run tracking and state management capabilities.
***
## Run States and Status Tracking
**Pipeline Run States**
Each pipeline run progresses through distinct execution states. The current state is displayed in the **Run Chipset** within the Flow View (Configuration tab).
| State | Visual Indicator | Description | Available Actions |
| --------------- | --------------------------------------------------------------------------------------------------------------------------------------------------------------------------------------------------------------------------------------------------------------------------------------------------------------------------------------------------------------------------------------------------------------------------------------------------------------------------------------------------------------------------------------------------------------------------------------------------------------------------------------------------------------------------------------------------------------------------------------------------------------------------------------------------------------------------------------------------------------------------------------------------------------------------------------------------------------------------------------------------------------------------------------------------------------------------------------------------------------------------------------------------------------------------------------------------------------------------------------------------------------------------------------------------------------------------------------------------------------------------------------------------------------------------------------------------------------------------------------------------------------------------------------------------------------------------------------------------------------------------------------------------------------------------------------------------------------------------------------------------------------------------------------------------------------------------------------------------------------------------------- | ------------------------------------ | -------------------------------- |
| **In Progress** |  | Pipeline is actively executing nodes | Stop execution |
| **Completed** |
| Pipeline is actively executing nodes | Stop execution |
| **Completed** |  | All nodes executed successfully | View details, Delete run |
| **Error** |
| All nodes executed successfully | View details, Delete run |
| **Error** |  | Execution failed with an exception | View error details, Delete run |
| **Stopped** |
| Execution failed with an exception | View error details, Delete run |
| **Stopped** |  | Manually stopped by user | View partial results, Delete run |
Run states are visible in the **Flow View** (Configuration tab), where the Run Chipset displays current and recent runs with their status indicators.
***
## Accessing Run Information
The **Run Chipset** appears in the **Configuration tab** (Flow View) and provides access to detailed run information.
### From Flow View (Pipeline Editor)
**Run Chipset Display:**
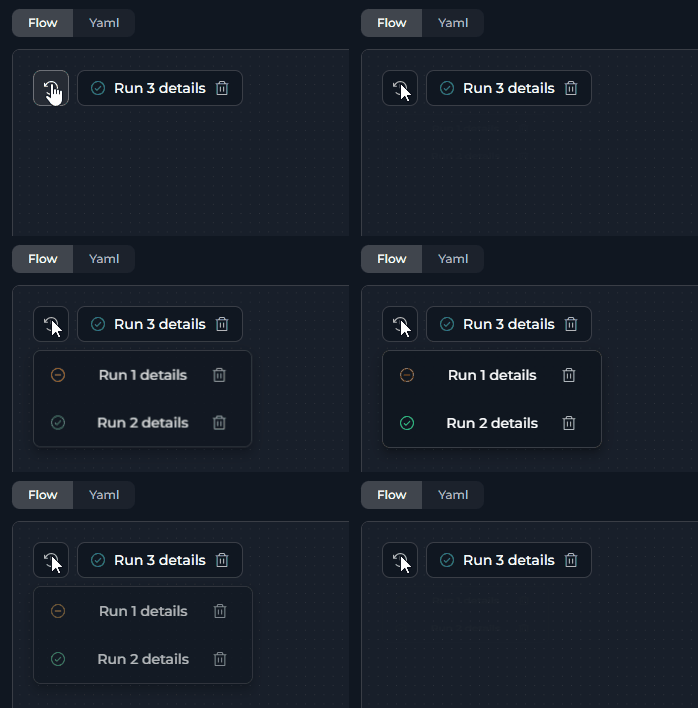
* **Single Run**: Shows one run chipset with status icon and run name
* **Multiple Runs**: Shows current run + history icon (🕐 clock icon) to access previous runs
* Click the history icon to view a dropdown of all previous runs
* Current/most recent run is always displayed separately
* Each run in the dropdown can be opened (click run name) or deleted (click delete icon)
| Manually stopped by user | View partial results, Delete run |
Run states are visible in the **Flow View** (Configuration tab), where the Run Chipset displays current and recent runs with their status indicators.
***
## Accessing Run Information
The **Run Chipset** appears in the **Configuration tab** (Flow View) and provides access to detailed run information.
### From Flow View (Pipeline Editor)
**Run Chipset Display:**
* **Single Run**: Shows one run chipset with status icon and run name
* **Multiple Runs**: Shows current run + history icon (🕐 clock icon) to access previous runs
* Click the history icon to view a dropdown of all previous runs
* Current/most recent run is always displayed separately
* Each run in the dropdown can be opened (click run name) or deleted (click delete icon)
 ### From Chat Interface
Access run information from chat executions through Canvas mode:
1. Navigate to Chat and add/select a pipeline
2. Execute pipeline with input or conversation starters
3. Click **Settings**(gear) button → Canvas view opens
4. Click **Flow Editor** tab
5. View Run Chipset and click run name for details
### From Chat Interface
Access run information from chat executions through Canvas mode:
1. Navigate to Chat and add/select a pipeline
2. Execute pipeline with input or conversation starters
3. Click **Settings**(gear) button → Canvas view opens
4. Click **Flow Editor** tab
5. View Run Chipset and click run name for details
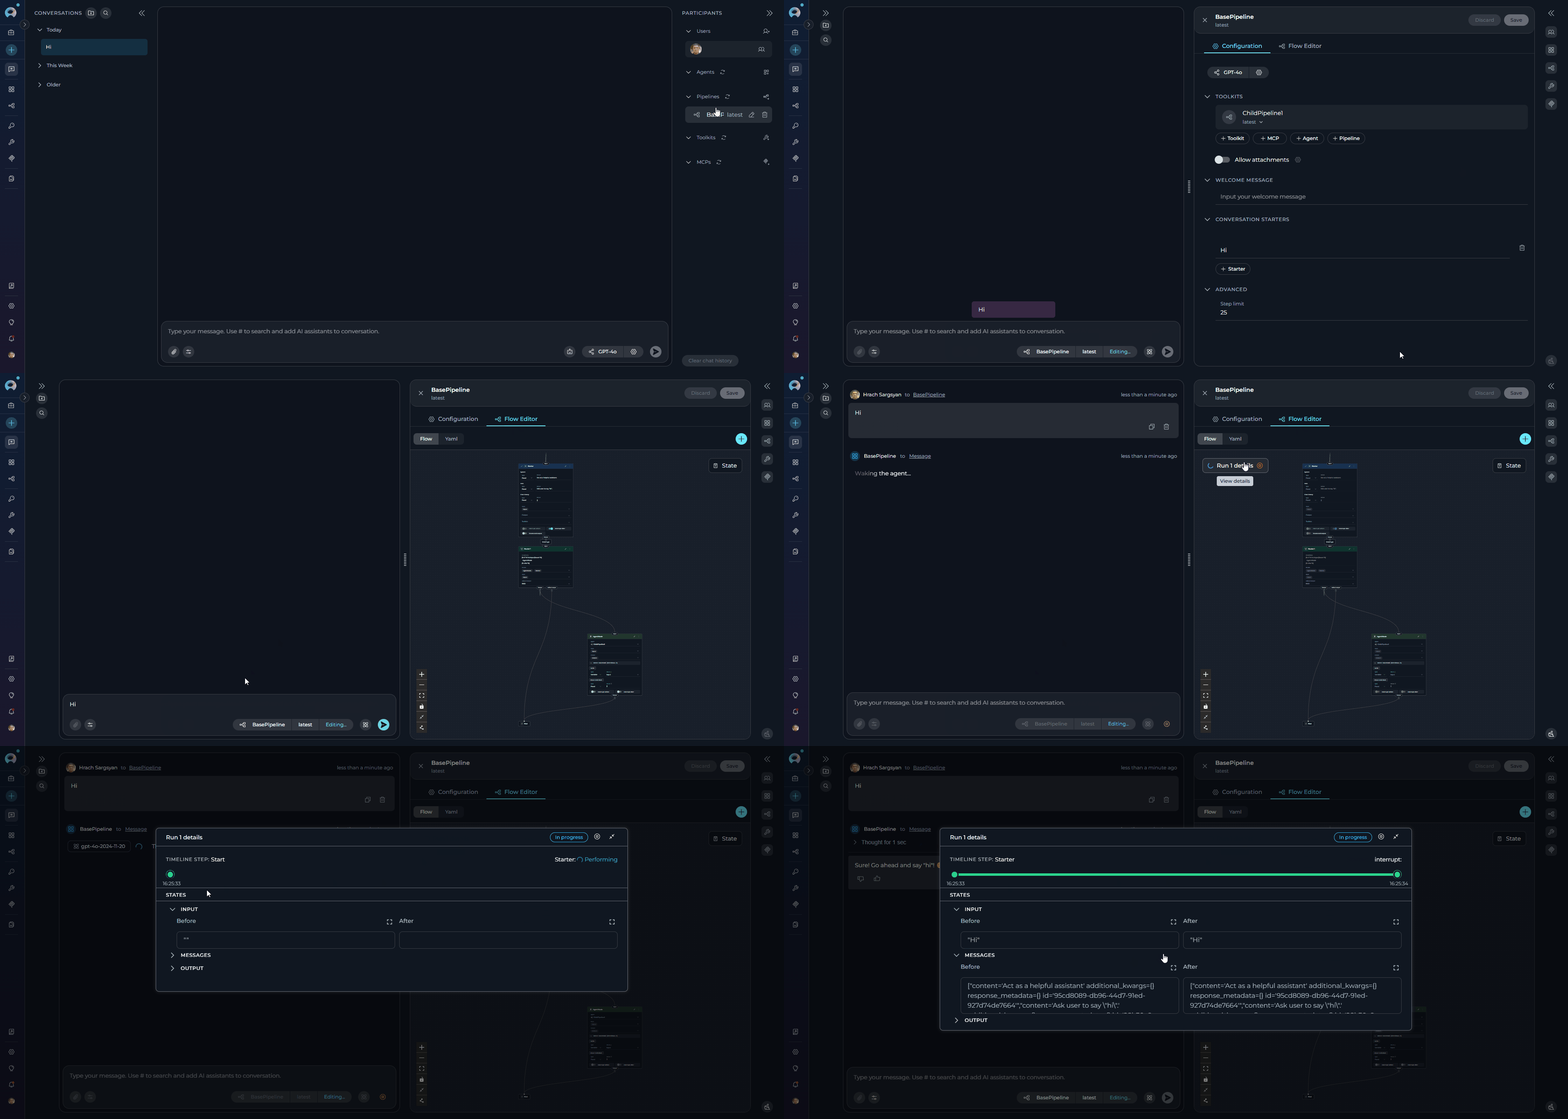 The Chat → Canvas → Flow Editor path provides the same run tracking capabilities as direct pipeline execution.
### Run Details Dialog
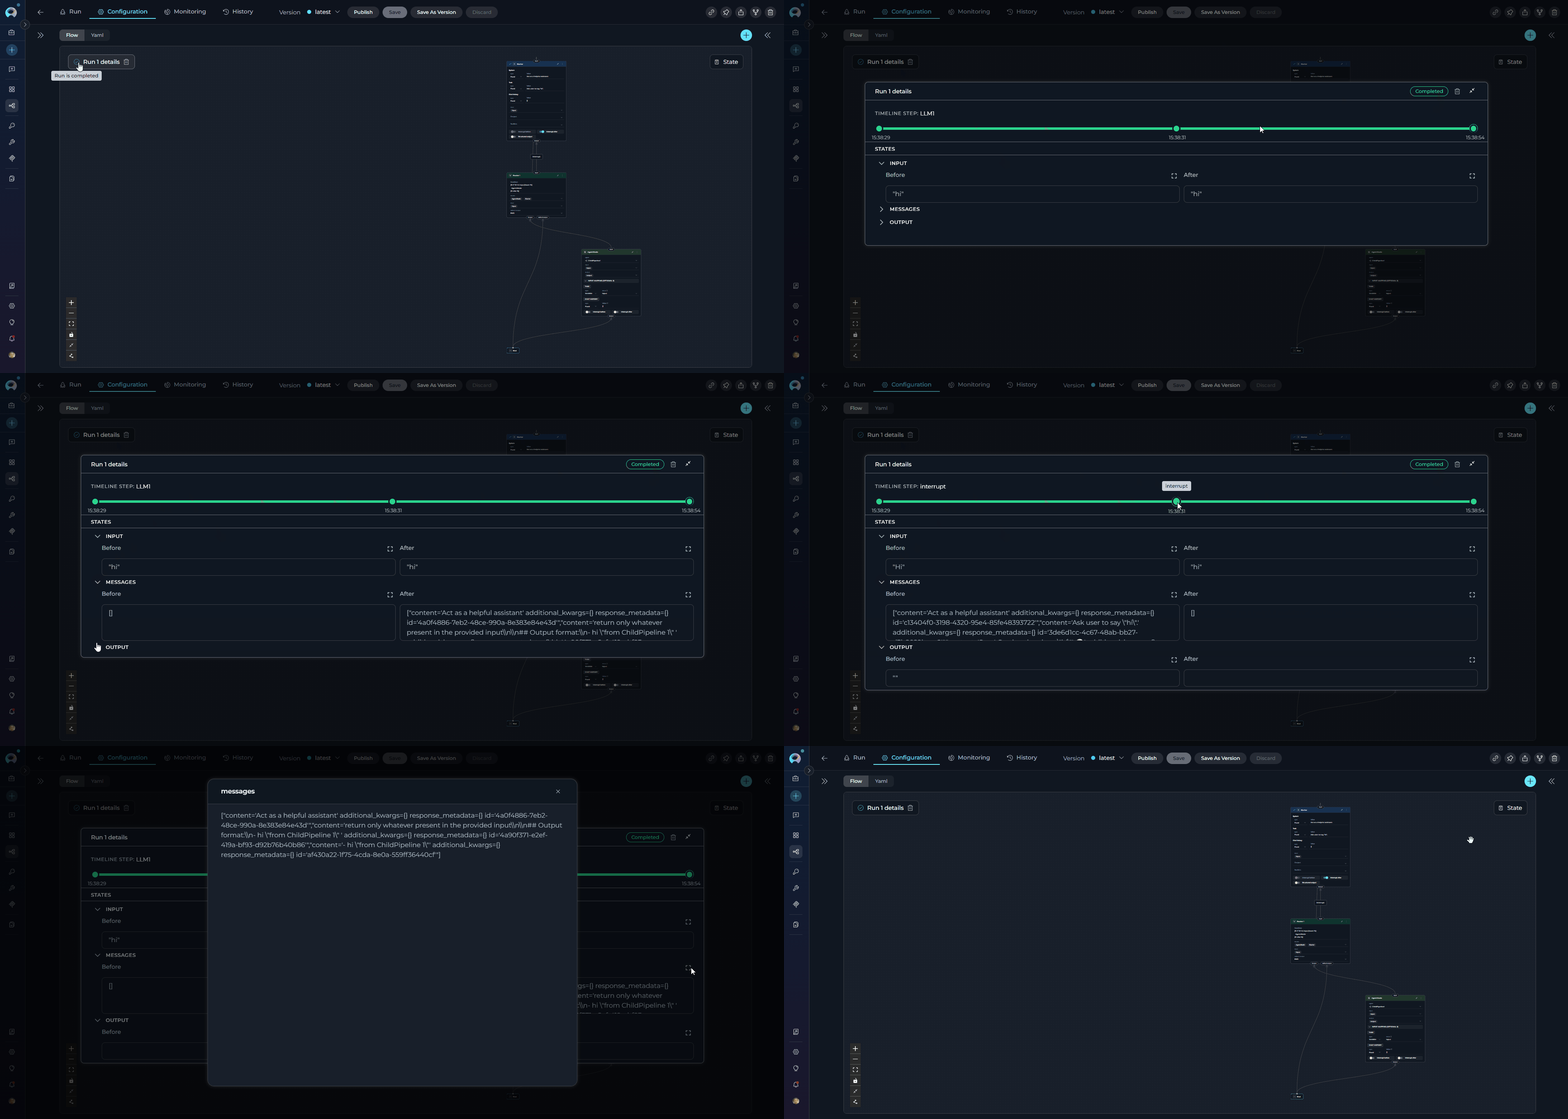
Click on any run name in the chipset to open the **Run Details Dialog**, which provides comprehensive information about the execution.
**Dialog Sections:**
1. **Header**
* Run name/label
* Current status badge
* Action buttons (Stop/Delete)
* Close button
2. **Timeline Section**
* **Timeline Step**: Shows current node being executed (or last completed node)
* **Status Indicator**: Real-time status of the current node
| Status | Description | Visual Indicator |
| --------------- | -------------------------- | --------------------------------------------------------------------------------------------------------------------------------------------------------------------------------------------------------------------------------------------------------------------------------------------------------------------------------------------------------------------------------------------------------------------------------------------------------------------------------------------------------------------------------------------------------------------------------------------------------------------------------------------------------------------------------------------------------------------------------------------------------------------------------------------------------------------------------------------------------------------------------------------------------------------------------------------------------------------------------------------------------------------------------------------------------------------------------------------------------------------------------------------------------------------------------------------------------------------------------------------------------------------------------------------------------------------------------------------------------------------------------------------------------------------------------------------------------------------------------------------------------------------------------------------------------------------------------------------------------------------------------------------------------------------------------------------------------------------------------------------------------------------------------------------------------------------------------------------------------------------------------------------------------------------------------------------------------- |
| **In Progress** | Node is actively executing |
The Chat → Canvas → Flow Editor path provides the same run tracking capabilities as direct pipeline execution.
### Run Details Dialog
Click on any run name in the chipset to open the **Run Details Dialog**, which provides comprehensive information about the execution.
**Dialog Sections:**
1. **Header**
* Run name/label
* Current status badge
* Action buttons (Stop/Delete)
* Close button
2. **Timeline Section**
* **Timeline Step**: Shows current node being executed (or last completed node)
* **Status Indicator**: Real-time status of the current node
| Status | Description | Visual Indicator |
| --------------- | -------------------------- | --------------------------------------------------------------------------------------------------------------------------------------------------------------------------------------------------------------------------------------------------------------------------------------------------------------------------------------------------------------------------------------------------------------------------------------------------------------------------------------------------------------------------------------------------------------------------------------------------------------------------------------------------------------------------------------------------------------------------------------------------------------------------------------------------------------------------------------------------------------------------------------------------------------------------------------------------------------------------------------------------------------------------------------------------------------------------------------------------------------------------------------------------------------------------------------------------------------------------------------------------------------------------------------------------------------------------------------------------------------------------------------------------------------------------------------------------------------------------------------------------------------------------------------------------------------------------------------------------------------------------------------------------------------------------------------------------------------------------------------------------------------------------------------------------------------------------------------------------------------------------------------------------------------------------------------------------------- |
| **In Progress** | Node is actively executing |  |
| **Completed** | Node finished successfully |
|
| **Completed** | Node finished successfully |  |
| **Error** | Node failed with an error |
|
| **Error** | Node failed with an error |  |
| **Stopped** | Manually stopped by user |
|
| **Stopped** | Manually stopped by user |  |
* **Visual Timeline**: Stepper component showing all executed nodes
* Each step shows timestamp (HH:mm:ss format)
* Click any step to view its state details
* Green connector line indicates successful progression
* Red connector line indicates error occurred
3. **States Section**
* Expandable accordion for each state variable
* **Before** and **After** values for each node execution
* Full-screen view button for detailed inspection
|
* **Visual Timeline**: Stepper component showing all executed nodes
* Each step shows timestamp (HH:mm:ss format)
* Click any step to view its state details
* Green connector line indicates successful progression
* Red connector line indicates error occurred
3. **States Section**
* Expandable accordion for each state variable
* **Before** and **After** values for each node execution
* Full-screen view button for detailed inspection
 ***
## Monitoring Execution
### Real-Time Monitoring
**During Active Execution:**
* **Run Chipset**: Shows blue circular progress indicator in Flow View
* **Timeline Tracking**: Run Details Dialog displays current node and timestamp
* **Node Highlighting**: Active node highlighted in Configuration tab
* **Chat Progress**: Results stream progressively in Run or Chat interface
**Monitoring Current State:**
1. Click run name in Run Chipset
2. Run Details Dialog opens
3. Timeline shows current node execution
4. States section displays real-time variable values
### Active Execution Indicators
**Flow View (Configuration Tab):**
* Run chipset displays with blue progress spinner
* Current node highlighted on canvas
* Timeline step shows "Performing" status
### Output Viewing
**State Inspection:**
* Open Run Details Dialog
* Expand state variable accordions
* View before/after values for each node
***
## Debugging and Error Handling
### Error State Details
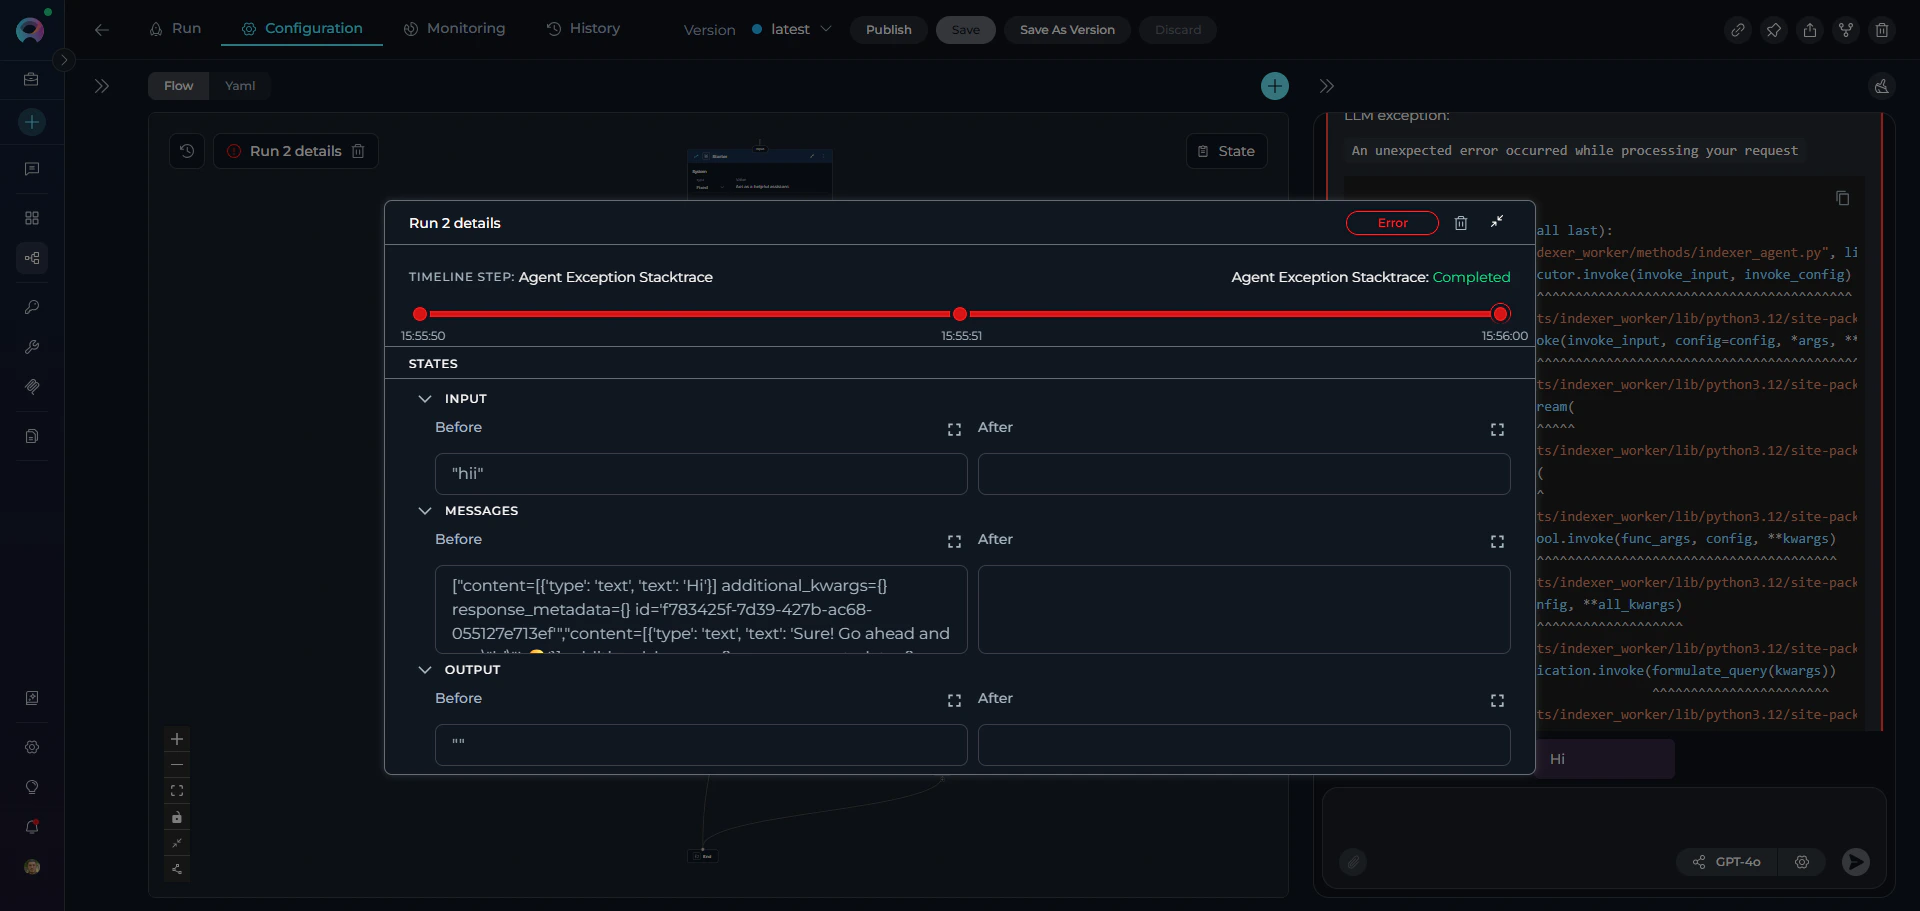
When a run enters **Error** state, the Run Details Dialog provides:
* **Error message**: Exception details displayed in red
* **Failed node**: Timeline highlights node where error occurred
* **State snapshot**: Variable values at time of failure
* **Stack trace**: Technical error information in chat interface
***
## Monitoring Execution
### Real-Time Monitoring
**During Active Execution:**
* **Run Chipset**: Shows blue circular progress indicator in Flow View
* **Timeline Tracking**: Run Details Dialog displays current node and timestamp
* **Node Highlighting**: Active node highlighted in Configuration tab
* **Chat Progress**: Results stream progressively in Run or Chat interface
**Monitoring Current State:**
1. Click run name in Run Chipset
2. Run Details Dialog opens
3. Timeline shows current node execution
4. States section displays real-time variable values
### Active Execution Indicators
**Flow View (Configuration Tab):**
* Run chipset displays with blue progress spinner
* Current node highlighted on canvas
* Timeline step shows "Performing" status
### Output Viewing
**State Inspection:**
* Open Run Details Dialog
* Expand state variable accordions
* View before/after values for each node
***
## Debugging and Error Handling
### Error State Details
When a run enters **Error** state, the Run Details Dialog provides:
* **Error message**: Exception details displayed in red
* **Failed node**: Timeline highlights node where error occurred
* **State snapshot**: Variable values at time of failure
* **Stack trace**: Technical error information in chat interface
 ***
## Best Practices
**Initialize with defaults:**
```yaml theme={null}
state:
search_query:
type: str
value: ""
max_results:
type: int
value: 10
```
**Always map node outputs:**
```yaml theme={null}
- id: "Fetch Data"
type: "function"
function: "jira_toolkit||search"
output: ["search_results", "messages"] # Required!
```
Use interrupts for:
* Validating data transformations
* Manual approval gates
* Debugging complex workflows
* Human-in-the-loop processes
**Configuration:**
```yaml theme={null}
interrupt_before:
- "Critical Processing Node"
interrupt_after:
- "Data Validation"
```
**During Development:**
* Use interrupt points to inspect state
* Add descriptive node names for clarity
* Test with edge cases and invalid inputs
**In Production:**
* Monitor run history for patterns
* Track error rates in Monitoring tab
* Set appropriate step limits
* Configure conversation starters for guidance
***
## Troubleshooting
### Common Execution Errors and Solutions
**Purpose**: Temporarily override state variable values to test specific scenarios or isolate issues.
**Method**: Set fixed values directly in the `state` section:
```yaml theme={null}
state:
issue_key:
type: str
value: "PROJ-123" # Hardcoded for testing
user_input:
type: str
value: "test query" # Override user input
max_results:
type: int
value: 5 # Fixed value for debugging
```
**Use Cases**:
* **Skip user input**: Test pipeline logic without manual entry
* **Reproduce errors**: Lock specific values that caused failures
* **Isolate node behavior**: Test individual nodes with known inputs
* **Validate transformations**: Use predictable data to verify outputs
**Best Practices**:
* Document hardcoded values with comments
* Remove or revert before production deployment
* Use interrupt points to verify hardcoded values are applied
* Test with multiple hardcoded scenarios (edge cases, invalid data)
Set hardcoded values + interrupt points to step through execution with controlled data:
```yaml theme={null}
state:
debug_data:
type: str
value: "test" # Hardcoded
interrupt_before:
- "Processing Node" # Pause to inspect
```
**Error Message:**
```
Entry point is not defined in the schema.
Please define 'entry_point' in the schema.
```
**Cause**: Pipeline has no starting node configured.
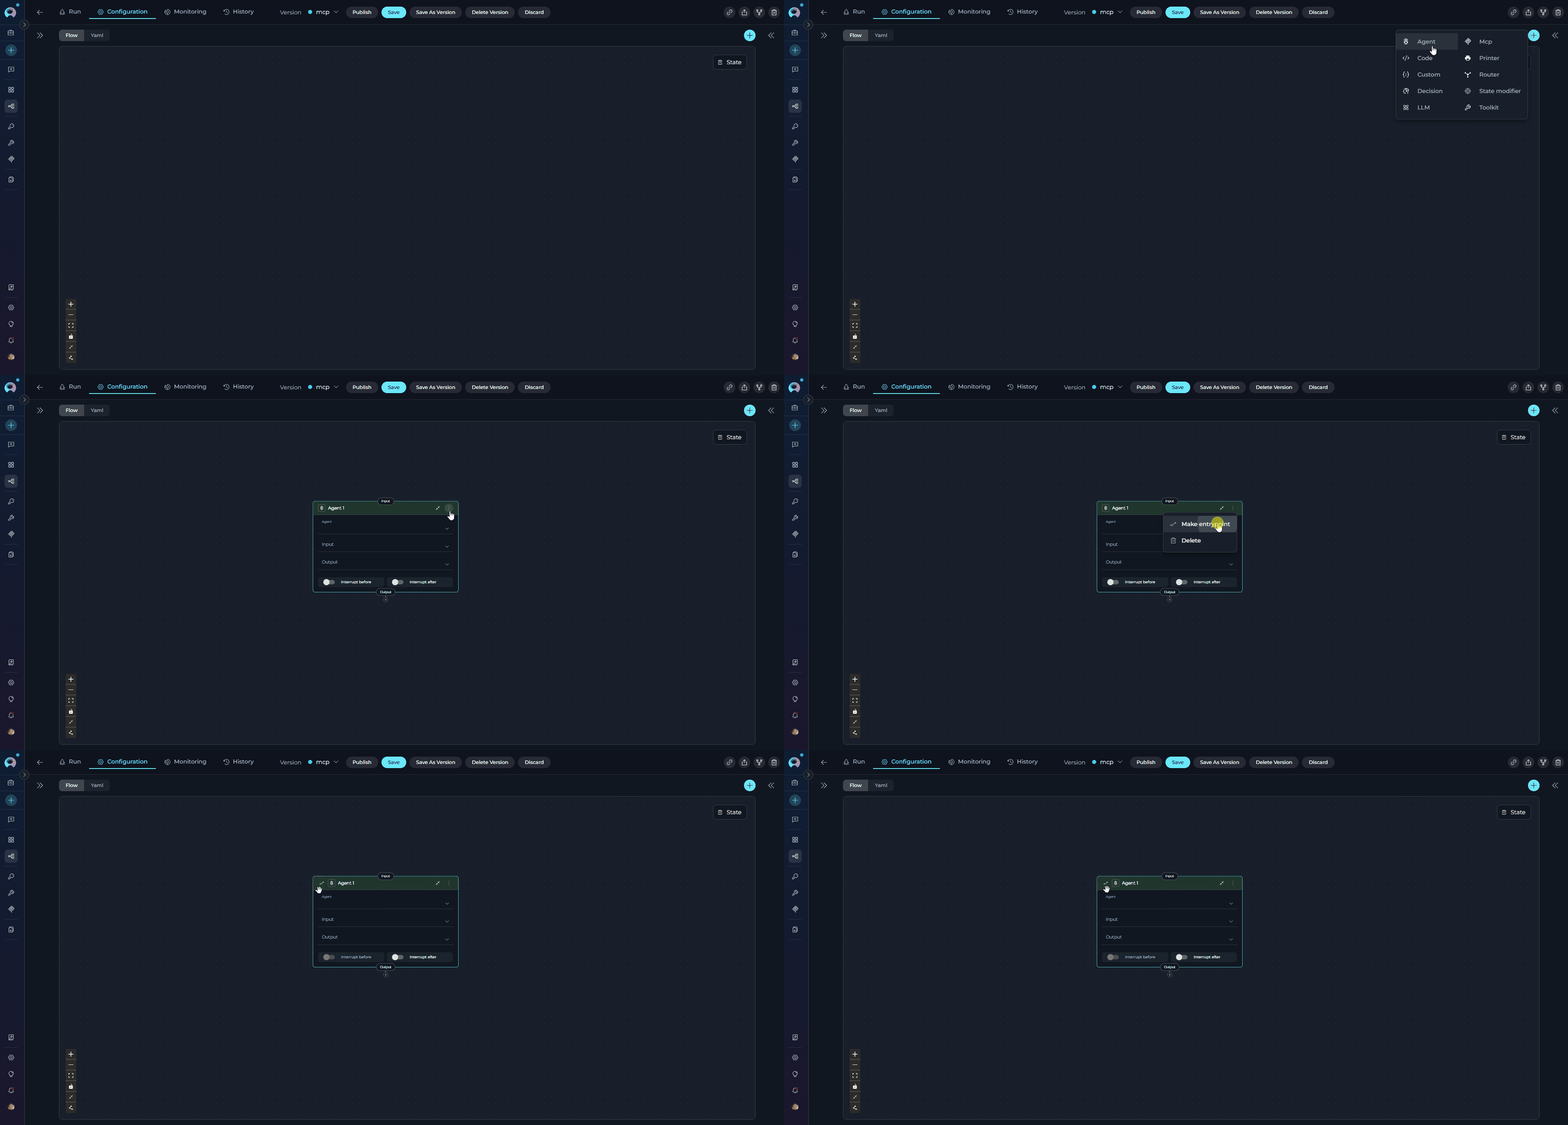
**Solution**:
1. Open pipeline in Configuration tab
2. Click three dots (⋮) on the node that should start execution
3. Select "Entry Point" from the menu
4. Save the pipeline
***
## Best Practices
**Initialize with defaults:**
```yaml theme={null}
state:
search_query:
type: str
value: ""
max_results:
type: int
value: 10
```
**Always map node outputs:**
```yaml theme={null}
- id: "Fetch Data"
type: "function"
function: "jira_toolkit||search"
output: ["search_results", "messages"] # Required!
```
Use interrupts for:
* Validating data transformations
* Manual approval gates
* Debugging complex workflows
* Human-in-the-loop processes
**Configuration:**
```yaml theme={null}
interrupt_before:
- "Critical Processing Node"
interrupt_after:
- "Data Validation"
```
**During Development:**
* Use interrupt points to inspect state
* Add descriptive node names for clarity
* Test with edge cases and invalid inputs
**In Production:**
* Monitor run history for patterns
* Track error rates in Monitoring tab
* Set appropriate step limits
* Configure conversation starters for guidance
***
## Troubleshooting
### Common Execution Errors and Solutions
**Purpose**: Temporarily override state variable values to test specific scenarios or isolate issues.
**Method**: Set fixed values directly in the `state` section:
```yaml theme={null}
state:
issue_key:
type: str
value: "PROJ-123" # Hardcoded for testing
user_input:
type: str
value: "test query" # Override user input
max_results:
type: int
value: 5 # Fixed value for debugging
```
**Use Cases**:
* **Skip user input**: Test pipeline logic without manual entry
* **Reproduce errors**: Lock specific values that caused failures
* **Isolate node behavior**: Test individual nodes with known inputs
* **Validate transformations**: Use predictable data to verify outputs
**Best Practices**:
* Document hardcoded values with comments
* Remove or revert before production deployment
* Use interrupt points to verify hardcoded values are applied
* Test with multiple hardcoded scenarios (edge cases, invalid data)
Set hardcoded values + interrupt points to step through execution with controlled data:
```yaml theme={null}
state:
debug_data:
type: str
value: "test" # Hardcoded
interrupt_before:
- "Processing Node" # Pause to inspect
```
**Error Message:**
```
Entry point is not defined in the schema.
Please define 'entry_point' in the schema.
```
**Cause**: Pipeline has no starting node configured.
**Solution**:
1. Open pipeline in Configuration tab
2. Click three dots (⋮) on the node that should start execution
3. Select "Entry Point" from the menu
4. Save the pipeline
 **Error Message:**
```
Missing required parameter: issue_key
During task with name 'Fetch Jira Ticket'
```
**Cause**: Node's input\_mapping references undefined or empty state variable.
**Solution**:
1. Check if variable is defined in `state` section
2. Verify previous nodes populate the variable
3. Add default value if appropriate:
```yaml theme={null}
state:
issue_key:
type: str
value: "" # Add default
```
**Error Message:**
```
Transition target 'Next Step' not found
```
**Cause**: Node's transition points to non-existent node.
**Solution**:
1. Open Flow Designer
2. Check connection from failing node
3. Ensure target node exists and is properly named
4. Update transition to correct node ID or END
**Error Message:**
```
Expected type 'int' but got 'str' for variable 'count'
```
**Cause**: Variable assigned value of wrong type.
**Solution**:
* Ensure type conversion in Code nodes:
```yaml theme={null}
- id: "Convert Types"
type: "code"
code:
type: "fixed"
value: |
count_str = alita_state.get('count', '0')
{"count": int(count_str)} # Convert to int
output: ["count"]
structured_output: true
```
***
**Understanding Error Structure:**
```
Error during task with name 'Node Name':
[Exception Type]: Error details here
Stack trace:
File "...", line X, in function
code line causing error
Current state:
variable1: value1
variable2: value2
```
**Key Components:**
1. **Node Name**: Where the error occurred
2. **Exception Type**: Type of Python error (KeyError, ValueError, etc.)
3. **Error Details**: Specific message about what went wrong
4. **Stack Trace**: Technical execution path (focus on end)
5. **Current State**: State variables at time of error
**Reading Tips:**
* Focus on the **last exception** in the stack trace
* Check **Current State** section for variable values
* Node Name tells you exactly where to look in your pipeline
* Exception Type hints at the category of problem
***
* **[Pipeline Overview](./overview)** - Understanding pipeline concepts and architecture
* **[Pipeline Nodes](./nodes/overview)** - Complete guide to all node types
* **[Pipeline States](./states)** - Managing state variables and data flow
* **[Flow Editor](./flow-editor)** - Visual pipeline design and editing
* **[YAML Configuration](./yaml)** - Text-based pipeline definition
* **[Agents and Pipelines History](../agents-pipelines/agents-pipelines-history)** - Detailed history tab guide
* **[Troubleshooting](../../support/troubleshooting)** - Common issues and solutions
**Error Message:**
```
Missing required parameter: issue_key
During task with name 'Fetch Jira Ticket'
```
**Cause**: Node's input\_mapping references undefined or empty state variable.
**Solution**:
1. Check if variable is defined in `state` section
2. Verify previous nodes populate the variable
3. Add default value if appropriate:
```yaml theme={null}
state:
issue_key:
type: str
value: "" # Add default
```
**Error Message:**
```
Transition target 'Next Step' not found
```
**Cause**: Node's transition points to non-existent node.
**Solution**:
1. Open Flow Designer
2. Check connection from failing node
3. Ensure target node exists and is properly named
4. Update transition to correct node ID or END
**Error Message:**
```
Expected type 'int' but got 'str' for variable 'count'
```
**Cause**: Variable assigned value of wrong type.
**Solution**:
* Ensure type conversion in Code nodes:
```yaml theme={null}
- id: "Convert Types"
type: "code"
code:
type: "fixed"
value: |
count_str = alita_state.get('count', '0')
{"count": int(count_str)} # Convert to int
output: ["count"]
structured_output: true
```
***
**Understanding Error Structure:**
```
Error during task with name 'Node Name':
[Exception Type]: Error details here
Stack trace:
File "...", line X, in function
code line causing error
Current state:
variable1: value1
variable2: value2
```
**Key Components:**
1. **Node Name**: Where the error occurred
2. **Exception Type**: Type of Python error (KeyError, ValueError, etc.)
3. **Error Details**: Specific message about what went wrong
4. **Stack Trace**: Technical execution path (focus on end)
5. **Current State**: State variables at time of error
**Reading Tips:**
* Focus on the **last exception** in the stack trace
* Check **Current State** section for variable values
* Node Name tells you exactly where to look in your pipeline
* Exception Type hints at the category of problem
***
* **[Pipeline Overview](./overview)** - Understanding pipeline concepts and architecture
* **[Pipeline Nodes](./nodes/overview)** - Complete guide to all node types
* **[Pipeline States](./states)** - Managing state variables and data flow
* **[Flow Editor](./flow-editor)** - Visual pipeline design and editing
* **[YAML Configuration](./yaml)** - Text-based pipeline definition
* **[Agents and Pipelines History](../agents-pipelines/agents-pipelines-history)** - Detailed history tab guide
* **[Troubleshooting](../../support/troubleshooting)** - Common issues and solutions